Global KYC Trends in 2023
Tackling KYC Amid Heightened Global Challenges.
Fenergo conducted extensive research into the KYC activity of the major corporate banks operating globally in 2023. The research surveyed 1100+ C-suite executives to uncover the realities of KYC, examining:


KYC Trends at a Glance
Fenergo surveyed over 1100 financial institutions in 2023 to understand the major KYC issues causing concern within the industry today. The work follows on from a similar survey conducted in 2022. Below we examine how trends have shifted across the issues surveyed.
Investment Areas of Risk
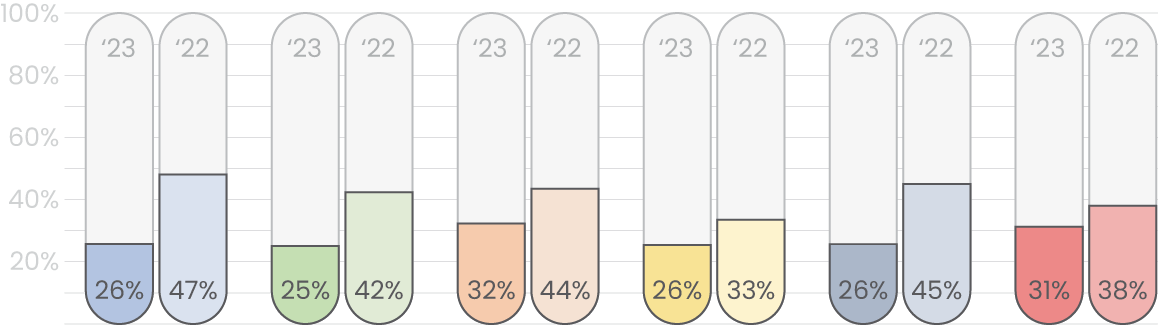
We asked financial institutions (FIs) what the three most important areas for risk they invested in regarding technology across 2023. Click through our infographic to see more.

Risk priorities have evened out across 2023 but information & cyber risk is still the leading concern, but not by much. As the world economy flows more freely other risks are becoming bigger threats.
2023 saw financial crime risk fall down the list of priorities in financial institutions for investment since 2022. It’s now ranked third, behind information and cyber risk and operational risk.
Coming in second as an investment priority globally, operational risk highlights the need for investment in streamlining processes internally at financial institutions.
One of the least invested in concerns for financial institutions globally, regulatory risk is still a vital issue. The capacity to respond to regulatory change is still a concern.
Many financial institutions are ensuring continued investment to prevent harm and bring positive outcomes for clients. But doing this well requires truly understanding these clients.
There has been a lot of press coverage on ESG in 2023 from multiple angles, but financial institutions are still invested in delivering positive ESG outcomes.
We asked financial institutions (FIs) what the three most important areas for risk they invested in regarding technology across 2023. Click through our infographic to see more.

Formerly the number three concern in 2022, information and cyber risk has moved into second place for the US as security concerns have grown in order to protect clients.
From the number one investment priority in 2022, financial crime risk has fallen to fourth place in 2023 as operational, information & cyber, and regulatory risk all supersede it.
Most US financial institutions focused on operational risk for technology investment, reflecting the opportunity for digital transformation efforts to deliver operational excellence in the region.
Financial institutions in the US are focused on ensuring regulatory risk is kept low to handle potential incoming updates to regulations such as the beneficial ownership thresholds update.
Lower priority than other risk categories, conduct risk remains a concern especially as high-profile misbehavior continues to make headlines in the US and abroad.
Investment in ESG risk controls lags behind the rest, but not by a significant margin. ESG is a concern for the US, but greater focus is on more critical risk vectors.
We asked financial institutions (FIs) what the three most important areas for risk they invested in regarding technology across 2023. Click through our infographic to see more.

After being the number one concern in 2022, information and cyber risk has moved into second place for the UK. Security remains a significant concern to protect clients.
The UK remains a major global center for money laundering, so it makes sense financial institutions are prioritizing financial crime risk for investment to satisfy regulators and remain compliant.
Investment in operational risk in the UK declined sharply from 2022. Digital disintermediation has been a driving force in the UK banking ecosystem but could be reducing in scope.
The regulatory environment has become more iron-clad in the past 12 months for the UK following a clamp down by the Financial Conduct Authority for AML compliance failures.
UK financial institutions are ensuring continued investment to prevent harm and bring positive outcomes for clients. But doing this well requires truly understanding these clients.
Investment in ESG risk controls is less impressive than for other risk vectors. ESG may be less of a factor for the UK market when compared to other risk priorities for investment.
We asked financial institutions (FIs) what the three most important areas for risk they invested in regarding technology across 2023. Click through our infographic to see more.

This data was collected for the first time in 2023, information and cyber risk ranks second, establishing the risk vector as a major source of investment for German financial institutions.
It’s a surprise to see financial crime risk technology investment rank as the lowest priority for German financial institutions, given the region’s reputation for strong compliance.
Many German financial institutions focused on operational risk for technology investment, reflecting the opportunity for digital transformation efforts to deliver operational excellence in the region.
The highest area for investment in Germany, this differs from the global trend and highlights the heavy weighting that regulator BaFIN places on immediate compliance with changing regulations.
While it’s a lower investment priority, conduct risk remains a concern especially as historic high-profile misbehavior continues to make headlines. Germany was rocked by scandal in recent years.
Investment in ESG risk controls is a continuing effort across German financial institutions. ESG is a concern for Germany, but there’s greater focus on existential risk vectors.
We asked financial institutions (FIs) what the three most important areas for risk they invested in regarding technology across 2023. Click through our infographic to see more.
From the top priority in 2022, information and cyber risk is in third place for technology investment in Singapore. Mostly due to the focus on creating better operational digital experiences.
Despite multiple major money laundering cases in Singapore and a toughening stance by the country’s regulator, financial crime risk is a priority for less than 25% of its financial institutions.
Now ranks in first place for Singapore, operational risk investment highlights the need to streamline processes internally at financial institutions. This falls in line with MAS aims for Singapore.
Sees significant investment in Singapore, this differs from the global trend and highlights the heavy weighting that regulator MAS places on immediate compliance with changing regulations.
Financial institutions are ensuring continued investment to prevent harm and bring positive outcomes for clients. While lower ranked, it is still of real importance to the region.
Investment in ESG risk controls is a growing effort across Singaporean financial institutions. ESG is a concern for Singapore, ranking second for investment.
We asked financial institutions (FIs) what the three most important areas for risk they invested in regarding technology across 2023. Click through our infographic to see more.

Risk priorities have evened out across 2023 but information & cyber risk is still the leading concern, but not by much. As the world economy flows more freely other risks are becoming bigger threats.
Japanese financial institutions are maintaining their focus on financial crime for tech investment. This is likely due to steady interest rates and concerns from FIs about reputational damage from compliance breaches.
Ranked third in 2023 for Japan, operational risk highlights the need for investment in streamlining processes at financial institutions. It has dropped since 2022 suggesting strides have been made.
Japanese financial institutions increased investment in regulatory risk. It has grown in maturity as a vital issue in Japan and the capacity to respond rapidly to regulatory change is being taken seriously.
Financial institutions are ensuring continued investment to prevent harm and bring positive outcomes for clients. While lower ranked, it is still of real importance to the region.
Investment in ESG risk controls is significantly less impressive than for other risk vectors. ESG may be less of a factor for the Japanese market.
We asked financial institutions (FIs) what the three most important areas for risk they invested in regarding technology across 2023. Click through our infographic to see more.
Risk priorities have evened out across 2023 but information & cyber risk is still significant. As the world economy flows more freely other risks are becoming bigger threats.
This has become the number one priority for technology investment. It is likely due to the high level of regulatory scrutiny and high profile AML enforcement actions against financial institutions.
Many Australian financial institutions focused on operational risk for technology investment, reflecting the opportunity for digital transformation initiatives to deliver operational excellence.
One of the least invested in areas for financial institutions in Australia, regulatory risk is still a vital issue. The capacity to respond to regulatory change is important but there are other priorities.
Financial institutions are ensuring continued investment to prevent harm and bring positive outcomes for clients. While low ranked, it is still of importance to the region.
Investment in ESG risk controls lags behind the rest, but not by a significant margin. ESG is a concern for Australia, but greater focus is on more critical risk vectors.
KYC Budget Allocation
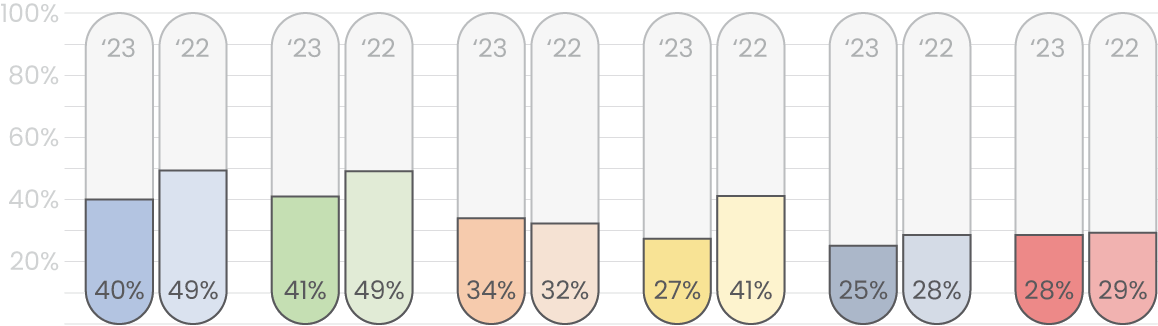
We asked FIs what percentage of their budget concerned KYC compliance. In 2023, we’re seeing increasing spend for KYC. Download the report for more insights.

A comparatively small number of financial institutions are spending up to 20% of their compliance budget on KYC. Most are spending far more. Download the report to see why.
The number of financial institutions spending up to 30% of their compliance budget on KYC has stayed relatively level since 2022.
Most financial institutions spend this much of their compliance budget on KYC, considering other compliance demands at play it shows how vital it is to get the KYC journey right.
The number of financial institutions spending up to 50% of their compliance budget on KYC has increased since 2022. Download the report to see what else is happening.
The number of financial institutions spending up to 60% of their compliance budget on KYC has stayed relatively level since 2022.
A tiny number of respondents are spending up to 70% of their compliance budget on KYC. Raising questions regarding how sustainable that current compliance approach could be.
We asked FIs what percentage of their budget concerned KYC compliance. In 2023, we’re seeing increasing spend for KYC. Download the report for more insights.

A comparatively small number of financial institutions are spending up to 20% of their compliance budget on KYC. Most are spending far more. Download the report to see why.
The number of financial institutions spending up to 30% of their compliance budget on KYC has stayed relatively static since 2022.
Most financial institutions spend this much of their compliance budget on KYC, considering other compliance demands at play it shows how vital it is to get the KYC journey right.
The number of financial institutions spending up to 50% of their compliance budget on KYC has decreased since 2022. Download the report to see what else is happening.
The number of financial institutions spending up to 60% of their compliance budget on KYC has stayed relatively level since 2022.
A tiny number of respondents are spending up to 70% of their compliance budget on KYC. Raising questions regarding how sustainable that current compliance approach could be.
We asked FIs what percentage of their budget concerned KYC compliance. In 2023, we’re seeing increasing spend for KYC. Download the report for more insights.
A comparatively small number of financial institutions are spending up to 20% of their compliance budget on KYC. Most are spending far more. Download the report to see why.
The number of financial institutions spending up to 30% of their compliance budget on KYC has stayed relatively static since 2022.
Most financial institutions spend this much of their compliance budget on KYC, considering other compliance demands at play it shows how vital it is to get the KYC journey right.
The number of financial institutions spending up to 50% of their compliance budget on KYC has increased since 2022. Download the report to see what else is happening.
The number of financial institutions spending up to 60% of their compliance budget on KYC has stayed relatively level since 2022.
A tiny number of respondents are spending up to 70% of their compliance budget on KYC. Raising questions regarding how sustainable that current compliance approach could be.
We asked FIs what percentage of their budget concerned KYC compliance. In 2023, we’re seeing increasing spend for KYC. Download the report for more insights.

A comparatively small number of financial institutions are spending up to 20% of their compliance budget on KYC. Most are spending far more. Download the report to see why.
The number of financial institutions spending up to 30% of their compliance budget on KYC has stayed relatively static since 2022.
Most financial institutions spend this much of their compliance budget on KYC, considering other compliance demands at play it shows how vital it is to get the KYC journey right.
The number of financial institutions spending up to 50% of their compliance budget on KYC has decreased since 2022. Download the report to see what else is happening.
The number of financial institutions spending up to 60% of their compliance budget on KYC has stayed relatively level since 2022.
A tiny number of respondents are spending up to 70% of their compliance budget on KYC. Raising questions regarding how sustainable that current compliance approach could be.
We asked FIs what percentage of their budget concerned KYC compliance. In 2023, we’re seeing increasing spend for KYC. Download the report for more insights.

A comparatively small number of financial institutions are spending up to 20% of their compliance budget on KYC. Most are spending far more. Download the report to see why.
The number of financial institutions spending up to 30% of their compliance budget on KYC has stayed relatively static since 2022.
Most financial institutions spend this much of their compliance budget on KYC, considering other compliance demands at play it shows how vital it is to get the KYC journey right.
The number of financial institutions spending up to 50% of their compliance budget on KYC has increased since 2022. Download the report to see what else is happening.
The number of financial institutions spending up to 60% of their compliance budget on KYC has stayed relatively level since 2022.
A tiny number of respondents are spending up to 70% of their compliance budget on KYC. Raising questions regarding how sustainable that current compliance approach could be.
We asked FIs what percentage of their budget concerned KYC compliance. In 2023, we’re seeing increasing spend for KYC. Download the report for more insights.

A comparatively small number of financial institutions are spending up to 20% of their compliance budget on KYC. Most are spending far more. Download the report to see why.
The number of financial institutions spending up to 30% of their compliance budget on KYC has stayed relatively static since 2022.
Most financial institutions spend this much of their compliance budget on KYC, considering other compliance demands at play it shows how vital it is to get the KYC journey right.
The number of financial institutions spending up to 50% of their compliance budget on KYC has decreased since 2022. Download the report to see what else is happening.
The number of financial institutions spending up to 60% of their compliance budget on KYC has stayed relatively level since 2022.
A tiny number of respondents are spending up to 70% of their compliance budget on KYC. Raising questions regarding how sustainable that current compliance approach could be.
We asked FIs what percentage of their budget concerned KYC compliance. In 2023, we’re seeing increasing spend for KYC. Download the report for more insights.

A comparatively small number of financial institutions are spending up to 20% of their compliance budget on KYC. Most are spending far more. Download the report to see why.
The number of financial institutions spending up to 30% of their compliance budget on KYC has stayed relatively static since 2022.
Coming in second as an investment priority globally, operational risk highlights the need for investment in streamlining processes internally at financial institutions.
The number of financial institutions spending up to 50% of their compliance budget on KYC has increased since 2022. Download the report to see what else is happening.
The number of financial institutions spending up to 60% of their compliance budget on KYC has stayed relatively level since 2022.
A tiny number of respondents are spending up to 70% of their compliance budget on KYC. Raising questions regarding how sustainable that current compliance approach could be.
Full Time Employees in KYC
We asked FIs how many employees they have focused on processing KYC reviews and other KYC related tasks. Download the report for more insights.

None of our surveyed FIs in 2023 have a team below 500 full-time employees, making for a marked change from 2022 suggesting that more FIs are taking KYC seriously.
There’s been an increase in the number of FIs that have up to 1000 full-time employees, reflecting a trend of investment in risk through KYC teams.
FIs have largely maintained the volume of KYC teams at this size but there has been a gradual increase in real terms across the world.
FIs have largely maintained the volume of KYC teams at this size but there has been a gradual decrease in some regions.
Teams of this size have decreased across many regions. KYC team size variations could be due to local regulatory focuses. Download the report to see more.
There was a slight jump in the number of teams of this size, suggesting that multiple FIs are solving for KYC processing issues with employees rather than digitally.
We asked FIs how many employees they have focused on processing KYC reviews and other KYC related tasks. Download the report for more insights.

None of our surveyed FIs in 2023 have a team below 500 full-time employees, making for a marked change from 2022 suggesting that more FIs are taking KYC seriously.
There’s been a decrease in the number of FIs that have up to 1000 full-time employees, reflecting a trend of investment in risk through KYC teams.
FIs have largely maintained the volume of KYC teams at this size but there has been a gradual increase in real terms across the world.
FIs have largely maintained the volume of KYC teams at this size but there has been a gradual decrease in some regions.
Teams of this size have decreased across many regions. KYC team size variations could be due to local regulatory focuses. Download the report to see more.
There was a slight jump in the number of teams of this size, suggesting that multiple FIs are solving for KYC processing issues with employees rather than digitally.
We asked FIs how many employees they have focused on processing KYC reviews and other KYC related tasks. Download the report for more insights.

None of our surveyed FIs in 2023 have a team below 500 full-time employees, making for a marked change from 2022 suggesting that more FIs are taking KYC seriously.
There’s been an increase in the number of FIs that have up to 1000 full-time employees, reflecting a trend of investment in risk through KYC teams.
FIs have largely maintained the volume of KYC teams at this size but there has been a gradual increase in real terms across the world.
FIs have largely maintained the volume of KYC teams at this size but there has been a gradual decrease in some regions.
Teams of this size have decreased across many regions. KYC team size variations could be due to local regulatory focuses. Download the report to see more.
There was a slight jump in the number of teams of this size, suggesting that multiple FIs are solving for KYC processing issues with employees rather than digitally.
We asked FIs how many employees they have focused on processing KYC reviews and other KYC related tasks. Download the report for more insights.

None of our surveyed FIs in 2023 have a team below 500 full-time employees, making for a marked change from 2022 suggesting that more FIs are taking KYC seriously.
There’s been an increase in the number of FIs that have up to 1000 full-time employees, reflecting a trend of investment in risk through KYC teams.
FIs have largely maintained the volume of KYC teams at this size but there has been a gradual increase in real terms across the world.
FIs have largely maintained the volume of KYC teams at this size but there has been a gradual decrease in some regions.
Teams of this size have decreased across many regions. KYC team size variations could be due to local regulatory focuses. Download the report to see more.
There was a slight jump in the number of teams of this size, suggesting that multiple FIs are solving for KYC processing issues with employees rather than digitally.
Time Spent on KYC Reviews
We asked FIs how long they spend on average to complete a KYC review for a corporate client. Download the report for more insights.

30 days review times have increased significantly in 2023, potentially due to reviews closing faster than previous years. Download the report to discover more.
There was a considerable reduction in the number of KYC reviews that took this length of time globally.
A few FIs reported a decrease in the number of KYC reviews that took up to 120 days globally. Download the report to learn more.
Many FIs reported that their average KYC review takes up to 150 days when reviewing corporate clients.
Review times of between 151 and 180 days have increased in 2023. Download the report to discover more.
A few FIs reported an increase in the number of KYC reviews that took between 181 and 210 days globally.
We asked FIs how long they spend on average to complete a KYC review for a corporate client. Download the report for more insights.

30 days review times have increased significantly in 2023, potentially due to reviews closing faster than previous years. Download the report to discover more.
There was a considerable reduction in the number of KYC reviews that took this length of time globally.
A few FIs reported a decrease in the number of KYC reviews that took up to 120 days globally. Download the report to learn more.
Many FIs reported that their average KYC review takes up to 150 days when reviewing corporate clients.
Review times of between 151 and 180 days have increased in 2023. Download the report to discover more.
A few FIs reported an increase in the number of KYC reviews that took between 181 and 210 days globally.
Dollars Spent Per KYC Review
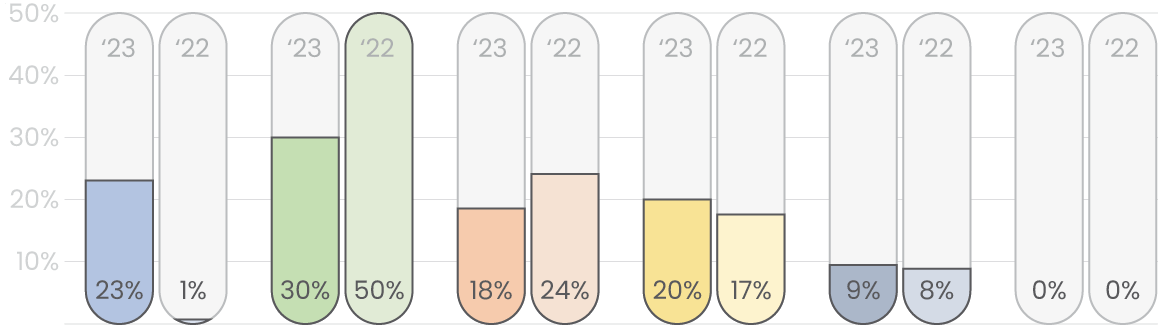
We asked FIs how much they spend on average for corporate or commercial clients per KYC review. Download the report for more insights.

2023 saw a noticeable reduction in the number of FIs spending this amount per KYC review globally with costs trending upwards overall. Download the report to find out more.
There was a slight reduction in the number of FIs that spent $1501 - $2000 on each KYC review for corporate clients in 2023 compared to 2022 worldwide.
Some regional reductions in the number of FIs that have this range of cost for KYC reviews suggest that it’s holding steady compared to other cost spans.
FIs have largely maintained the volume of KYC teams at this size but there has been a gradual decrease in some regions.
There is a small but noticeable jump in the percentage of FIs that spend in this range globally for KYC reviews in 2023.
A fair percentage of FIs are spending this amount on KYC reviews, but in the report, we explore the numbers for the FIs where KYC reviews cost even more. Download it now.
We asked FIs how much they spend on average for corporate or commercial clients per KYC review. Download the report for more insights.

2023 saw a noticeable reduction in the number of FIs spending this amount per KYC review globally with costs trending upwards overall. Download the report to find out more.
There was a slight reduction in the number of FIs that spent $1501 - $2000 on each KYC review for corporate clients in 2023 compared to 2022 worldwide.
Some regional reductions in the number of FIs that have this range of cost for KYC reviews suggest that it’s holding steady compared to other cost spans.
This range included the mean cost of KYC reviews for corporate clients in 2023 across the world but to unpack the numbers for further insights download the report now.
There is a small but noticeable jump in the percentage of FIs that spend in this range globally for KYC reviews in 2023.
A fair percentage of FIs are spending this amount on KYC reviews, but in the report, we explore the numbers for the FIs where KYC reviews cost even more. Download it now.
Effective KYC in a Complex Landscape
KYC spotlights the tension between meeting complex regulatory requirements and satisfying heightened client expectations.
Data is everything to the KYC experience, but the more required the more friction for clients. But the research Fenergo has conducted suggests evolution is happening in the industry.

Chapter One: KYC in Stalemate
KYC is time-consuming, resource intensive, and can delay time to revenue or jeopardize the client relationship for banks. We benchmark how the industry is performing and if progress is ongoing.
Chapter Two: The State of KYC
Costs associated with KYC exist across many metrics. We highlight how price per KYC review, and the time taken to conduct them have shifted.
Chapter Three: The Great Talent Gap
Has KYC talent reduced in 2023 and if so, why? We explore the changing headcounts across the industry and the need for technology investment.
What the industry says...
increase in FIs employing between 2,500 and 3,000 employees
average cost to complete single KYC review for a corporate
of FIs lost a client to inefficient onboarding
of FIs cannot adapt to increased transaction volumes

Manage KYC with Fenergo
Marc Murphy, CEO of Fenergo, joined Financial IT at Sibos to explain how putting compliance at the center of technology solutions is the best way to solve regulatory challenges by:
- Future-proofing FIs against regulatory change
- Unlocking revenue potential through technology
- Easily ensuring it’s safe to do business with clients
Watch the interview now.
Other Resources

ON-DEMAND WEBINAR: KYC, AML, & Onboarding in 2023. Were lessons learned?
Discussing how slow onboarding drives away clients. When investment spend is going for technology. Transaction monitoring challenges that plug into KYC. The role of AI, slow onboarding, our infographic below, and much more.

AWARD: Fenergo Leads Chartis RiskTech® Quadrant for KYC.
Fenergo is helping financial institutions solve the real problems of customer onboarding with superlative KYC solutions.
.webp)
REPORT: KYC in 2022, A Final Frontier for Digital Transformation.
This report investigates the direct and opportunity costs of allocating huge resources to KYC functions. Authored by Stella Clarke, Chief Strategy & Marketing Officer & Cengiz Kiamil, Vice President, Strategy @Fenergo.